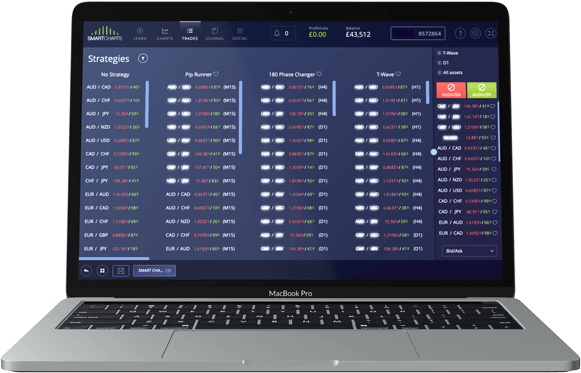
- Strategy Scanner
This is a favourite for many thousands of SmartCharts users. Unlike many other platforms, which requires you to code and create your own strategies, with SmartCharts you get access to our proprietary trading strategies. SmartCharts scans all available markets in milliseconds to find available possible opportunities, taking away the time consuming and difficult work of searching hundreds of charts. As soon as the scanner finds an opportunity that matches the strategy criteria, it will provide you with set-up alert. Once you have analysed and found a trade you like, SmartCharts will perform the risk sizing and trade calculations for you, allowing you to simply confirm your optimum entry, stop, take profit and risk size with a couple of clicks.
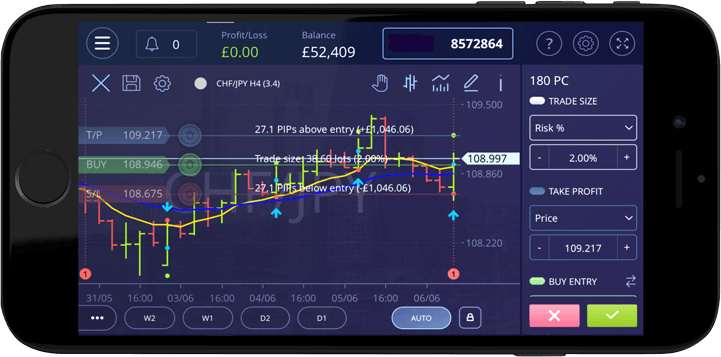
- Auto Risk Sizing
At SmartCharts we believe that risk management is probably the most important aspect of trading. We don’t understand why most trading platforms won’t let you simply enter in the % of your account you want to risk per trade. Instead, many require you to use equations to translate the amount you want to risk per trade risk into lots or $ per point. This makes the process longer and more prone to error. So, to prevent this, we designed SmartCharts to do all the calculations for you. All you need to do is simply enter in the % risk you want to risk per trade. Of course, if you want to risk manage using a monetary amount, lots or $ per point, you can do that as well, this is why we call it SmartCharts.
- Visual Trading
On many traditional trading platforms, you are often required to complete input fields on large trading tickets to place trades. This way of doing things is a bit old-fashioned and limited, and often leads to mistakes because traders don’t see the real-time positioning of their orders on the charts. In SmartCharts, we have built a concise and easy-to-see trading ticket that supports the traditional input method whilst showing you in real-time how your order has been updated on the chart. We then took the logical next step and designed the platform to let you edit your trading ticket visually from the orders on charts. Drag, drop, confirm. Welcome to the world of true visual trading.
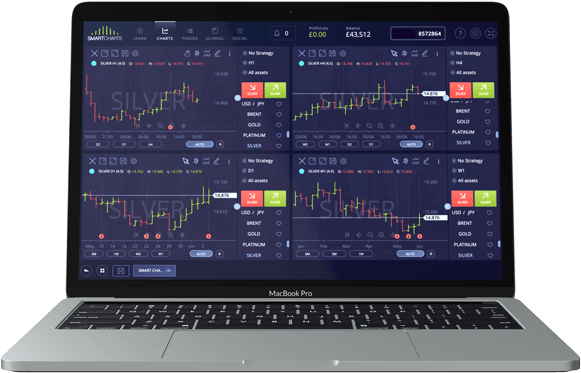
- Multi-Chart Workspace
Being able to easily compare potential trading opportunities and price action on multiple charts at once is essential to make sure you are making trading decisions based on a complete awareness of market conditions. SmartCharts makes comparing opportunities easy by allowing you to save workspace layouts, with up to four charts visible at once. The layout system enables you to save the arrangement of windows that you prefer and change between different multi-chart workspaces. You have some powerful tools to help you change all charts symbols at once, making the important job of multiple timeframe analysis a breeze.

- Comprehensive Library of Indicators and Drawing Tools
SmartCharts has a large palette of analysis tools. Each one of its 97 drawing tools and indicators can be edited down to the finest details, giving you the ability to analyse charts and trades in a wide variety of ways. We have also focused our efforts to provide additional tools that give you an extra edge, such as our pattern drawing tools and detailed measuring tools.
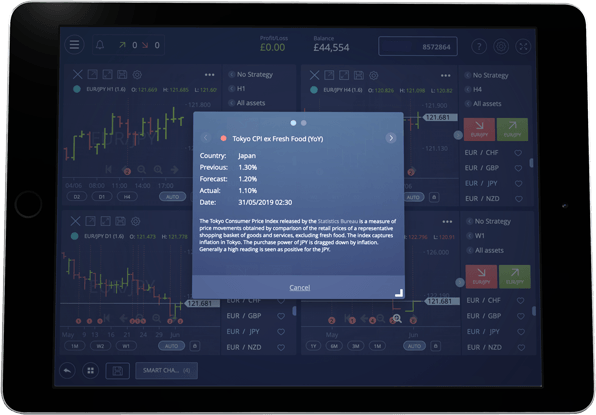
- Built-In News
News can often create volatility in the market. With other platforms, it’s up to you to try and find out what is happening and when, from other sources. But in SmartCharts, keeping an eye on what’s coming up couldn’t be easier. To make sure you don’t miss an upcoming news release, we have built the news right into the charts as dotted lines. When using SmartCharts, you can filter your view to see low, medium and high impact news according to your needs.
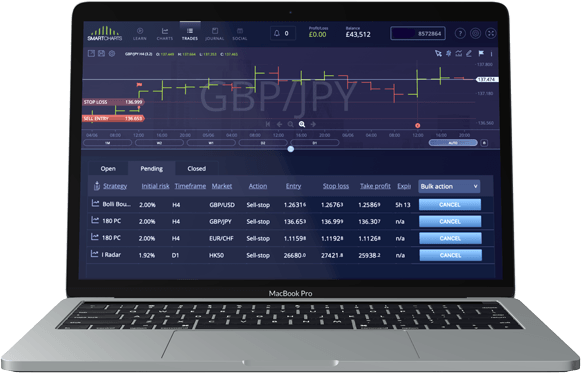
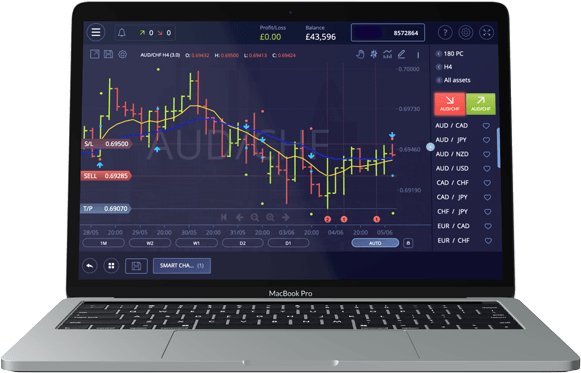
- Trade Manager
Managing your portfolio of current and historic trades is as important as managing each individual trade in flight. In SmartCharts, that’s made easy by having a powerful trade manager tool, where you can quickly find and manage all your open and pending trades.
- Bulk Action Trade Management: SmartCharts allows you to manage trades individually as well as manage trades in bulk. Want to close several trades at once? Our trade manager makes it easy.
- Visually Managing Orders: In addition, all the editing and managing of your orders can be done visually, right on the chart itself with our visual trade ticket. Confused with complex trading tickets? Our visual order management makes things simpler.
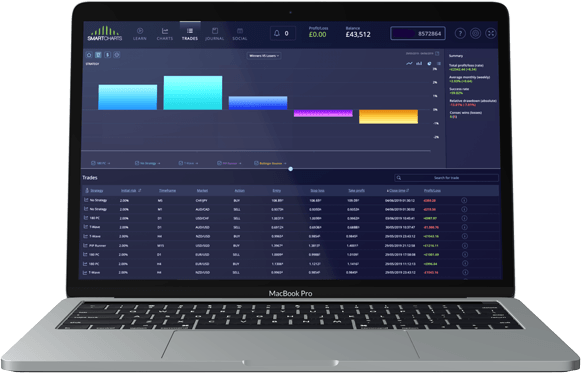
- Trading Journal
Whilst essential, keeping a trading journal can feel like a lot of homework, unless of course you have SmartCharts doing it with you. SmartCharts has a state-of-the-art trading journal built in, which enables you to find your trading strengths and weakness.
- Review strategy and symbol performance: Want to see your best trading strategy? Or discover which currency pair you are best at trading? SmartCharts can review and compare the performance of your trading strategies, presenting that information to you so you can focus on your strengths (and of course address any opportunities for improvement). It can determine which symbols for that strategy performed best. You can flip it around to see which markets were worst performing for you, so you can determine which strategies to avoid or focus on for different currencies. Knowledge is power, and SmartCharts puts that power into your hands.
- Review your trading times: Have you ever wondered when you trade best? Ever wondered when are you giving money back to the markets? SmartCharts can intelligently help you review your trading performance by day of the week, hour of the day or month of the year.
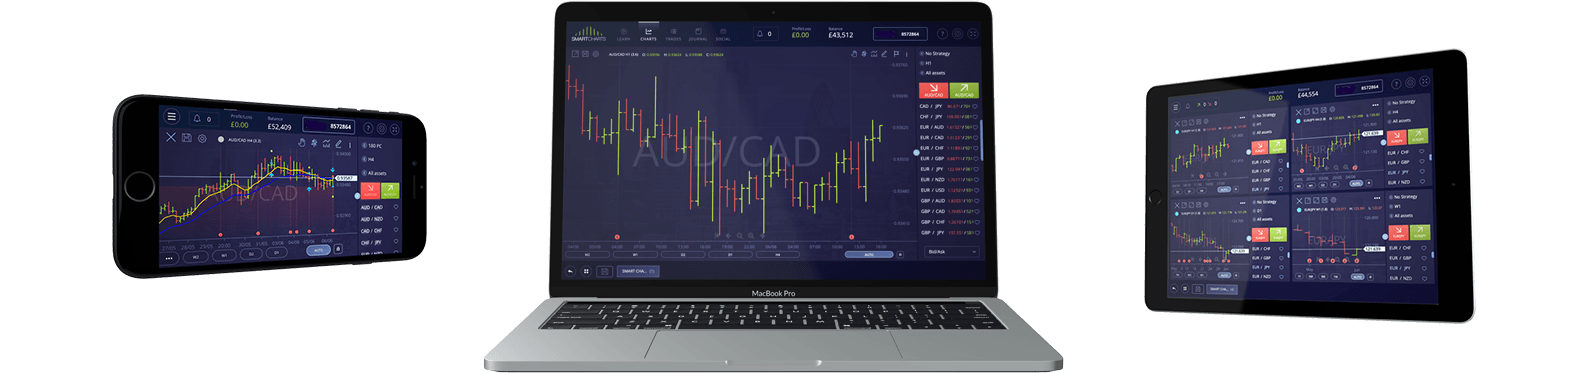
- Powerful and Portable - The Platform that you can Fit in your Pocket
Many trading platforms are based around a desktop app with a separately designed mobile app, with a limited set of functions available to you. They often have dramatically different layouts, compelling you to learn both separately. We decided to design the SmartCharts platform to be the same, whichever device you use. The same design and the same essential trading capabilities in a completely responsive system that adapts itself intelligently to the size of the screen. Because SmartCharts is cloud-based, all the hard work is done by our servers and not your device, so you can use it on almost any smart technology, anywhere you happen to be.
Products that are traded on margin carry a risk of losses which could be equal to your entire investment. The products may not be suitable for all investors. Please ensure that you fully understand the risks involved. Please see the full Risk Warning.